Credit Growth Drives Economic Growth, Until It Doesn’t

Posted May 19, 2011
The single most important thing to understand about economics in the age of paper money is that credit growth drives economic growth. Before the breakdown of the Bretton Woods international monetary system in 1971, there was a difference between money and credit. There no longer is. Paper dollars and US treasury bonds denominated in paper dollars are just different types of government IOUs. When gold was money, the increase in the Money Supply (M1 and M2) had an extraordinary impact on the economy. Today, what matters is the increase in the total supply of credit.
The best source of information about credit and credit growth in the United States is the Flow of Funds, published quarterly on the website of the Federal Reserve. Every serious analyst of the US economy should be familiar with the Fed’s Flow of Funds. Google it.
At the end of 2010, $52.6 trillion of credit was outstanding in the United States. Table L.1 Credit Market Debt Outstanding of the Flow of Funds provides a detailed breakdown of who the debt is owed by (debtors) in the top half of the table and who the debt is held by (creditors) in the bottom half of the table. The total amount of debt is equal to the total amount of credit. Debt and credit are two sides of the same coin. The data in this breakdown extends back to the late 1940s and the historical data series can be downloaded onto Excel, making trend analysis relatively easy.
In 1971, the ratio of total credit to GDP was 150%. Now it is 354%. In other words, credit has been growing much more rapidly than the economy for the past four decades. It is easy to understand how rapid credit growth facilitates economic growth. When credit is expanding, consumers can borrow and spend more and businesses can borrow and invest more. Increasing consumption and investment creates jobs and expands income and profits. Moreover, the expansion of credit tends to cause the price of assets such as stocks and property to increase, thereby boosting the net worth of the public. Rising asset prices give the owners of assets more wealth (i.e. collateral) against which they can borrow still more. This cycle of expanding credit leading to increased spending, investment, job creation and wealth, followed by still more borrowing produces a happy upward spiral of prosperity….so long as it continues. Eventually, however, every credit-induced economic boom comes to an end when one or more important sector of the economy becomes incapable of repaying the interest on its debt.
The Flow of Funds breaks down the US credit market into three main categories: the domestic non-financial sector (69% of total debt), the domestic financial sector (27%) and the rest of the world (4%). The non-financial sector is comprised primarily of the household sector, the corporate sector and the federal government. The financial sector is comprised primarily of the Government Sponsored Enterprises (GSEs) such as Fannie Mae and Freddie Mac, the mortgage pools that the GSEs guarantee, the issuers of asset backed securities and commercial banks.
In recent decades, the financial sector has expanded its debt much more rapidly than the non-financial sector, and therefore has played the more important role in creating economic growth. In 1971, the debt of the financial sector was equivalent to 12% of GDP. It hit 100% of GDP in 2005, peaked at 121% of GDP (or roughly $17 trillion) in 2008 and is now 96% of GDP. The sharp reduction in the sector’s debt after the crisis began in 2008 was made possible by the first round of Quantitative Easing, during which the Fed printed $1.7 trillion and used it primarily to buy assets from the financial sector, thereby allowing the financial sector to reduce its leverage.
The surge in the debt of the financial sector between 1971 and 2008 was driven by two subsectors: 1) the GSEs and the mortgage pools they guaranteed and 2) the issuers of asset backed securities (ABS). The debt of the former group expanded from 4% of GDP in 1971 to a peak of 58% of GDP (or $8.1 trillion) in 2009. It has subsequently fallen to 51% of GDP. The debt of the latter group expanded from zero in 1971 to a peak of 32% of GDP (or $4.6 trillion) in 2007. It has subsequently fallen to 17% of GDP.
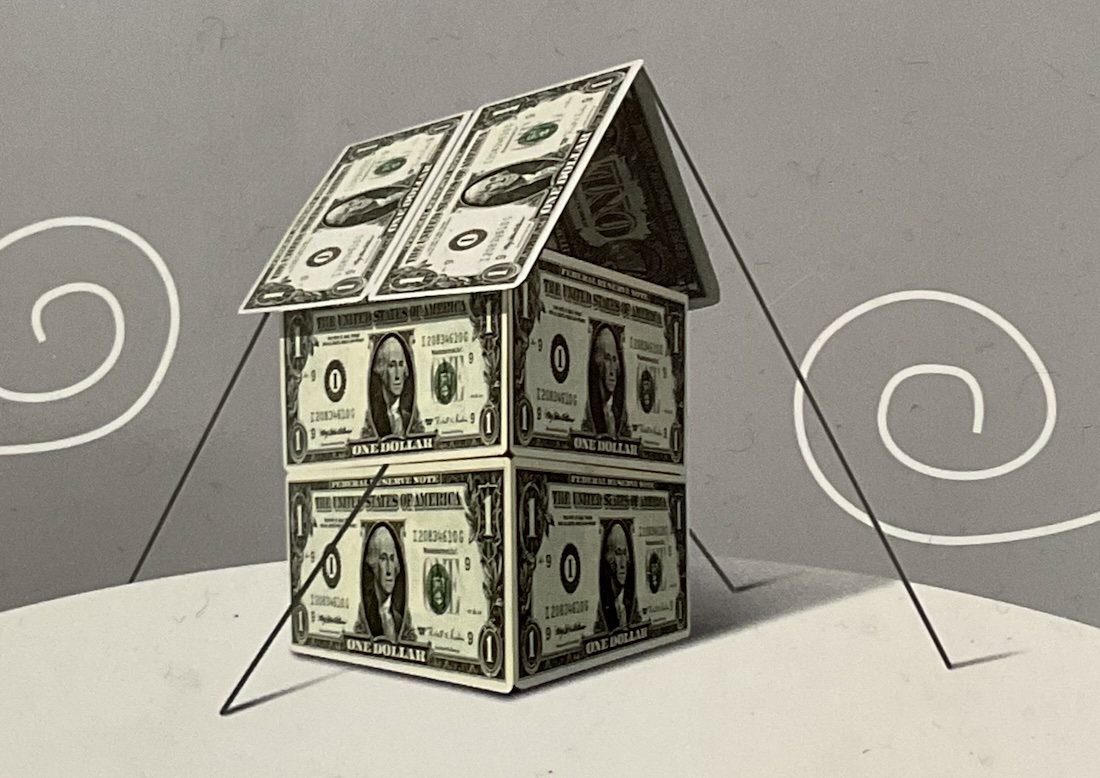
The GSEs and ABS issuers increased their debt by selling bonds. They used the cash they received from issuing bonds to buy mortgages (and, in the case of the ABS issuers, to also buy a smaller amount of credit card loans, auto loans, etc). By buying trillions of dollars worth of mortgages, they financed and fuelled the US property bubble. Inflating home prices allowed the American public to treat their homes as ATM machines, from which they “withdrew” equity.
Between 1971 and 2009, household sector debt increase from 43% of GDP to 98% of GDP (or to $13.9 trillion). Borrowing and spending by US households drove the US economy; and, as imports into the US exploded and the US trade deficit blew out to a previously unimaginable level, it also drove the global economy. Like every credit bubble, this one was fun while it lasted. However, when large numbers of American home owners could no longer service the interest on their mortgages in 2008, Fannie and Freddie had to be nationalized and most of the issuers of asset backed securities failed.
Over the last two years, the debt of the financial sector has contracted by $2.9 trillion (to $14.2 trillion) and the debt of the household sector has contracted by $443 billion (to $13.4 trillion). Offsetting that has been a $3 trillion increase in the debt of the federal government (to $9.4 trillion). Overall, total credit in the US increased by 0.4% or $203 billion (to $52.6 trillion). Like credit, economic growth in the United States has been essentially flat, increasingly by only 0.1% or by $19 billion between 2008 and 2010.
The $3 trillion increase in US government debt prevented a global depression over the last two years, but what sector of the economy will take on additional debt and drive the economy over the years immediately ahead? Go down the list on Table L.1. Will it be the household sector? The corporate sector? State and local government? Will Fannie and Freddie or the ABS issuers come back from the dead? No, no, no and no. The only sector of the US economy that can finance significant amounts of new debt is the federal government. Economic growth in the United States (and therefore, to a very significant extent, the world) will be determined by how much more the US government borrows and spends. Those who wish to slash government spending should bear that in mind.
Note: For additional details on US debt, please see The Corruption of Capitalism, Chapter 10, “America Doesn’t Work”.


Another excellent article! I could be wrong, but I don’t believe intra-governmental liabilities are factored into total credit market debt. Most of the inter-governmental liabilities are IOUs owed to Social Security, which I think are in excess of $3 trillion. Only the government could legally borrow from a pension fund to cover operating costs.
Richard,
As always with you, interesting stuff. However, I can’t really tell from the article what policy you’re advocating, or whether you’re simply pointing out that we’re stuck in a Catch-22. Are you suggesting that we stop worrying deficits and keep accelerating the credit machine in order to ward off colllapse?
Excellent analysis and very informative. I would agree with Mark B that the last two lines add some confusion to what your main point is. Many of us who advocate slashing government spending realize that is will devastate economic growth and send us into severe depression. Unfortunately, after decades of running up this credit bubble, that’s the best alternative.
If U.S. Government Spending is the key, then the keys of the key are to spend it wisely, efficiently, effectively, spend it just in time, and spend it to grow seeds, more seeds, that are going to bear fruits and later multiply harvests …
Some people use 2 dollars like they only have 1 dollar; some use 1 dollar like they have 2 …
It depends on, who, what, where and how we spend money …
There is a similar story in the new testament ….
Brilliant analysis. I googled the flow of funds and it is quite informative.
I am afraid war is on the horizon. That gives the government to borrow and spend significantly more, further enrich the banksters and the military-industrial complex, divert attention from the economic environment and send the unemployed to die abroad (so that they don’t protest at home). Pakistan is a prime candidate.